

Understanding Volatility in the Digital Social Advertising Market
A Weekly CPM and Momentum Breakdown (Dec 16–22, 2025)
Digital social advertising is inherently volatile. Pricing shifts quickly as demand, inventory, seasonality, and advertiser behavior collide in real time. In this post, we break down a single week of market data to explain how volatility manifests, what the signals mean, and how advertisers and analysts should interpret them historically.
This analysis combines: - Daily volatility metrics - CPM movement across thousands of ad spots - Advertiser activity context from top brands in the market
1. The Volatility Metrics: What We’re Measuring
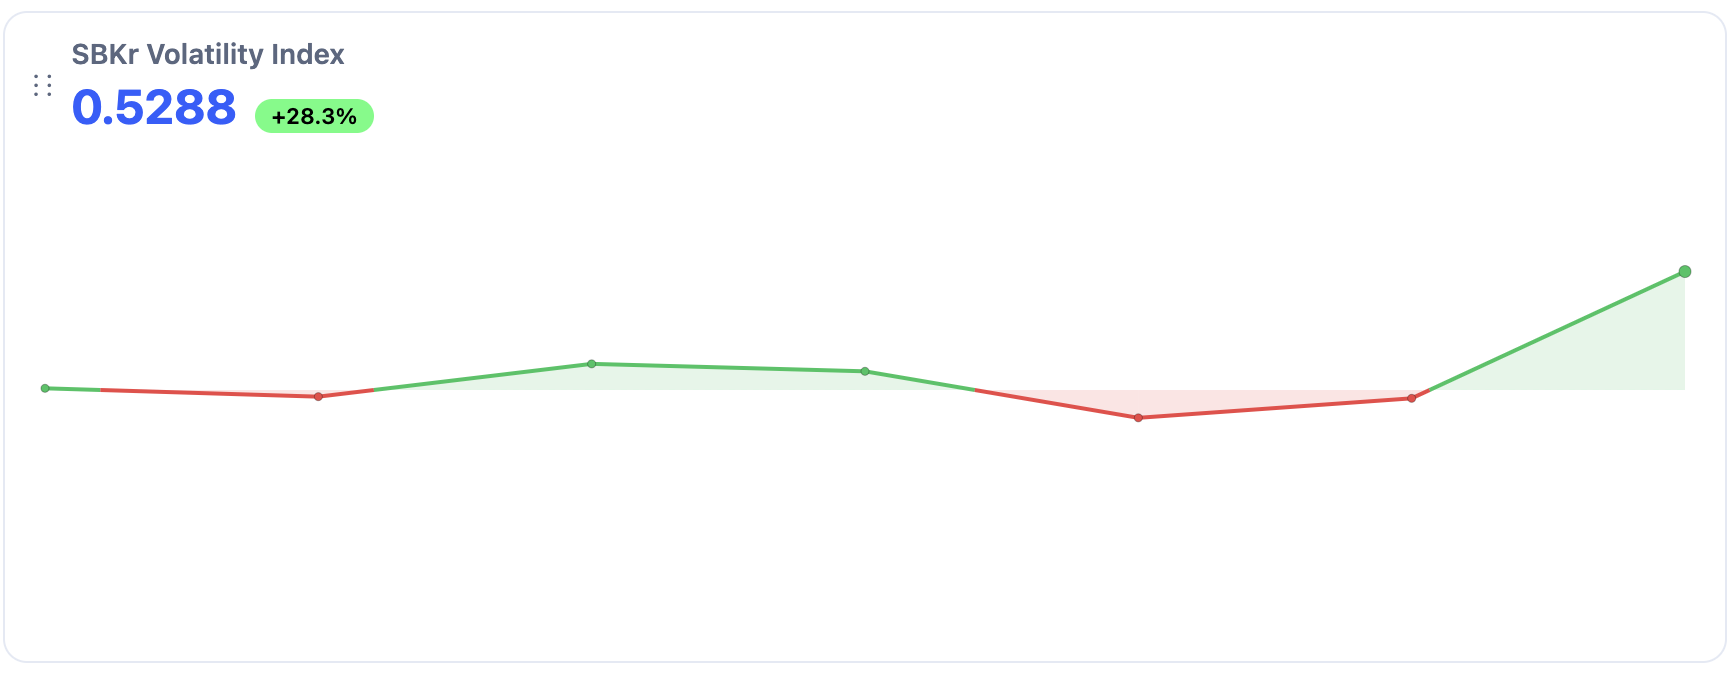
Below is the daily volatility index observed across the social ad market:
| Date | Volatility Metric |
|---|---|
| 2025-12-16 | 0.008 |
| 2025-12-17 | -0.030 |
| 2025-12-18 | 0.117 |
| 2025-12-19 | 0.083 |
| 2025-12-20 | -0.124 |
| 2025-12-21 | -0.037 |
| 2025-12-22 | 0.529 |
How to Interpret This Metric
 - Positive values indicate expansion: rising prices, demand pressure, or competitive bidding.
- Negative values indicate contraction: cooling demand, excess supply, or pullback behavior.
- Magnitude matters more than direction — large absolute values signal instability or regime shifts.
- Positive values indicate expansion: rising prices, demand pressure, or competitive bidding.
- Negative values indicate contraction: cooling demand, excess supply, or pullback behavior.
- Magnitude matters more than direction — large absolute values signal instability or regime shifts.
Historically, values above ±0.10 tend to coincide with structural changes rather than normal daily noise.
2. CPM Movement: The Market’s Price Response
The volatility index becomes more meaningful when paired with actual CPM behavior.
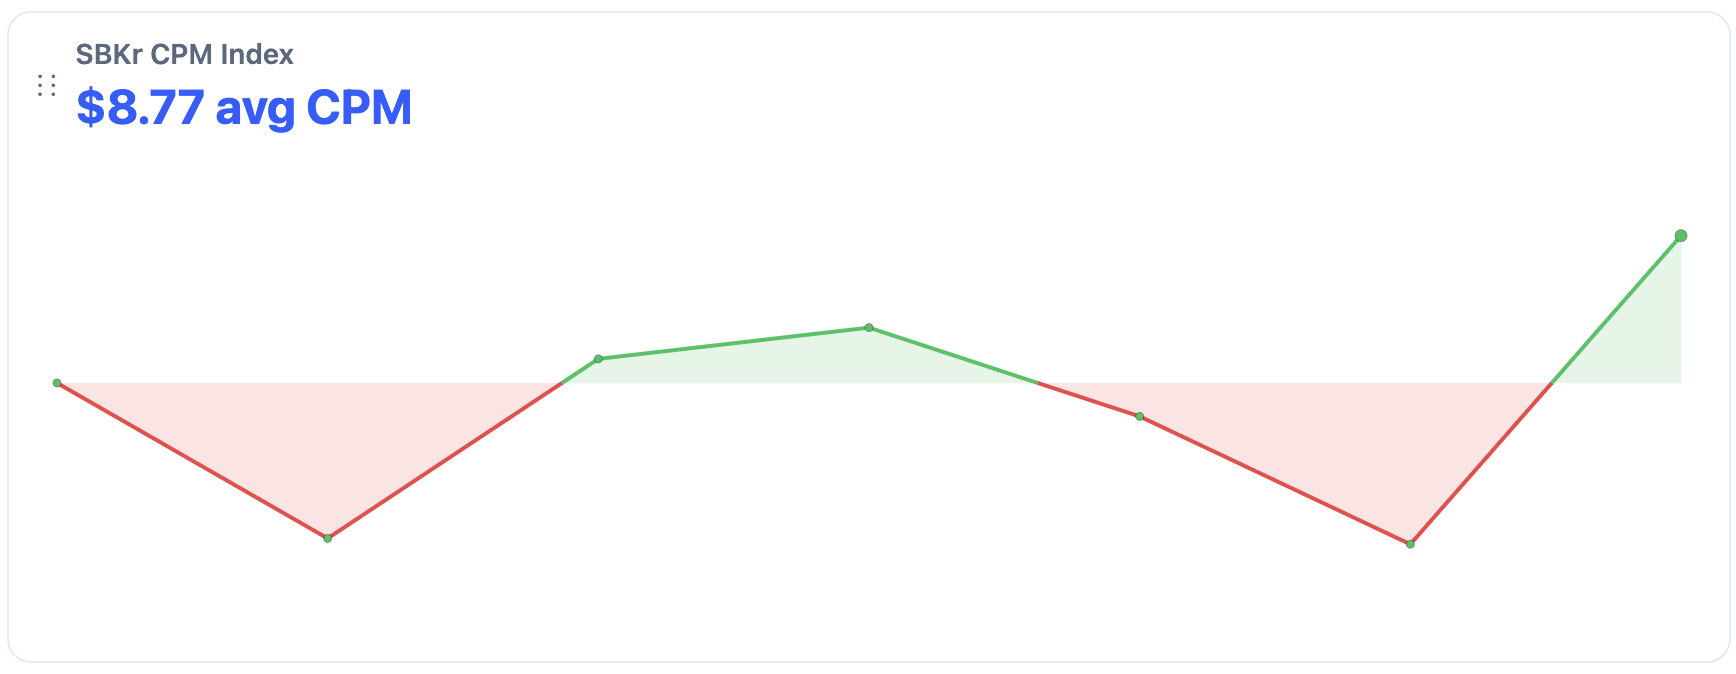
Daily Average CPMs
| Date | Avg. CPM | Spot Count |
|---|---|---|
| 2025-12-16 | $8.85 | 73 |
| 2025-12-17 | $8.14 | 66 |
| 2025-12-18 | $8.96 | 112 |
| 2025-12-19 | $9.11 | 121 |
| 2025-12-20 | $8.70 | 49 |
| 2025-12-21 | $8.11 | 37 |
| 2025-12-22 | $9.53 | 146 |
Dataset context:
These CPMs are derived from over 5,200 observed ad spots, filtered to daily averages.
3. Day-by-Day Breakdown
December 16–17: Flat to Slight Contraction
- Volatility: 0.008 → -0.030
- CPM: $8.85 → $8.14
This reflects a stable-to-softening market. Advertisers are active, but bidding pressure is muted. Historically, this pattern is common early in a campaign cycle or during midweek inventory normalization.
December 18–19: Controlled Expansion
 - Volatility: 0.117 → 0.083
- CPM: $8.96 → $9.11
Here we see healthy upward momentum: - More spots entering the market - CPMs rising gradually - Volatility positive but contained
This is a classic competitive equilibrium phase where brands scale spend without triggering runaway pricing.
December 20–21: Demand Pullback
- Volatility: -0.124 → -0.037
- CPM: $8.70 → $8.11
This dip aligns with a weekend slowdown effect: - Fewer active campaigns - Lower spot volume - Advertisers temporarily pausing or pacing spend
Historically, negative volatility during weekends does not indicate weakness — it often sets the stage for a rebound.
December 22: Volatility Spike (Regime Shift)
- Volatility: 0.529
- CPM: $9.53
- Highest spot volume of the week
This is the most important data point.
A volatility reading above 0.50 is extremely rare and typically signals: - Sudden demand inflow - Budget unlocks or end-of-cycle spending - Multiple large advertisers entering simultaneously
This type of spike represents a pricing regime change, not a normal fluctuation.
4. Advertiser Activity as a Volatility Driver
During this week, the market saw strong activity from globally recognized brands across: - Payments & fintech - Consumer goods - Travel & booking platforms - Media & entertainment - Ecommerce & retail
Brands such as PayPal, Booking.com, Amazon, Disney, and major consumer packaged goods advertisers were actively running multiple high-reach spots simultaneously.
Why This Matters
Historically, volatility spikes correlate less with who spends the most and more with: - How many large advertisers overlap in timing - How concentrated their campaigns are - How aggressively they scale within short windows
When multiple brands push inventory at once, CPMs react sharply — even if individual advertisers are pacing efficiently.
5. Historical Context: Is This Normal?
Yes — and no.
What’s Normal
- Mild volatility midweek
- Weekend softening
- Gradual CPM climbs during campaign ramp-ups
What’s Not Normal
- A 0.529 volatility jump paired with:
- The highest CPM of the week
- The highest spot volume
- Immediate post-weekend re-entry
Historically, this pattern is associated with: - End-of-quarter budget releases - Seasonal demand inflection points - Platform-level inventory shifts
6. What This Tells Us About the Market
This week illustrates a core truth of social advertising economics:
Volatility is not randomness — it is compressed information.
By reading volatility alongside CPMs and advertiser density, we can infer: - When pricing power shifts - When competition intensifies - When the market enters a new short-term regime
For advertisers, this means: - Timing matters as much as targeting - Stable CPMs can hide growing pressure - Spikes often arrive after quiet periods, not before
Final Takeaway
The Dec 16–22 window shows a textbook volatility cycle:
1. Stability
2. Expansion
3. Pullback
4. Sharp re-acceleration
Understanding these patterns historically allows marketers, analysts, and platforms to move from reactive buying to anticipatory strategy — identifying inflection points before CPMs fully reprice.
Volatility isn’t noise.
It’s the market speaking quickly.