
Public agencies publish an enormous amount of data about the places they serve: who lives there, what they earn, how they get to work, whether they can afford their homes, whether they are online. Most of it reaches the public as spreadsheets, PDF reports and data portals that only an analyst can use. The people who need it most, a planner preparing for a council meeting, a grant writer making the case for a neighborhood, a resident trying to understand their own community, rarely see it in a form they can explore.
There is a second problem, and it is less often discussed. Much of this data comes from surveys, and survey figures carry a margin of error. In a small area that margin can be larger than the figure itself. A map that colors a shaky estimate exactly like a solid one invites people to draw conclusions the data cannot support.
Today, Spotbookr is introducing Interactive Web Mapping, the newest of our Government Solutions. We design, build and host interactive maps and dashboards on an agency's own data, so that anyone can explore it, and so that every figure is shown with how much it can be trusted.
A live demo you can use today
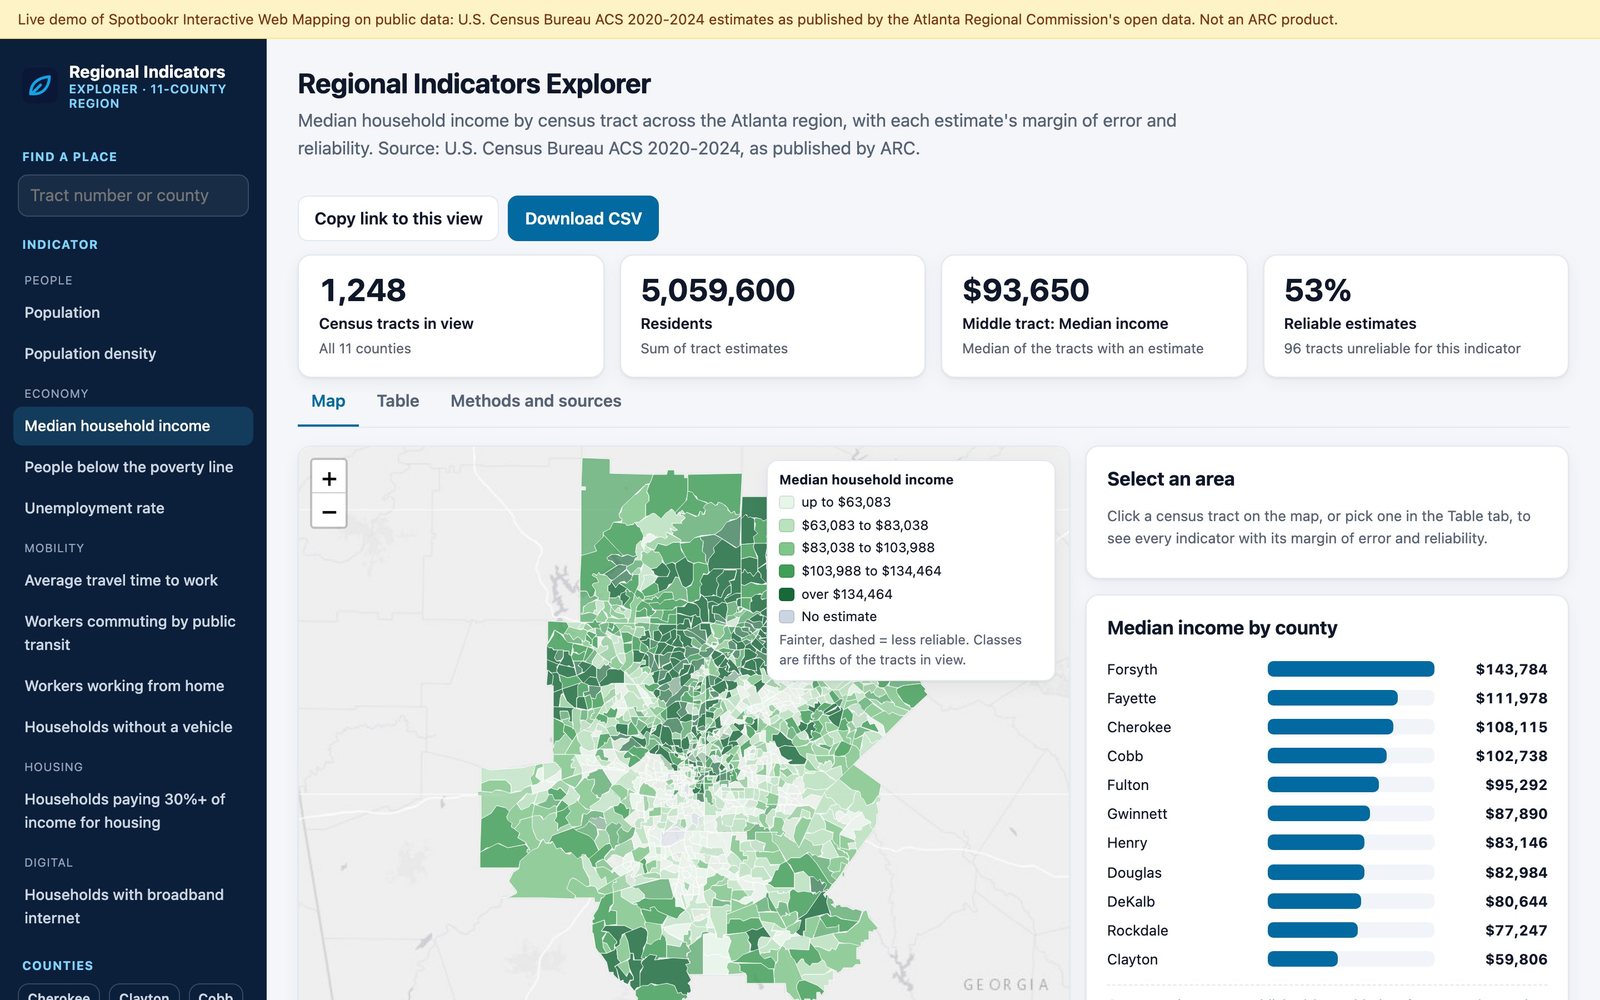
Rather than describe it, we built one. The live demo maps eleven indicators from the U.S. Census Bureau's American Community Survey for every census tract in the eleven-county Atlanta region, more than 1,200 neighborhoods and about five million people, read directly from the region's public open data. We are starting with Atlanta, and more metropolitan areas are on the way.
You can:
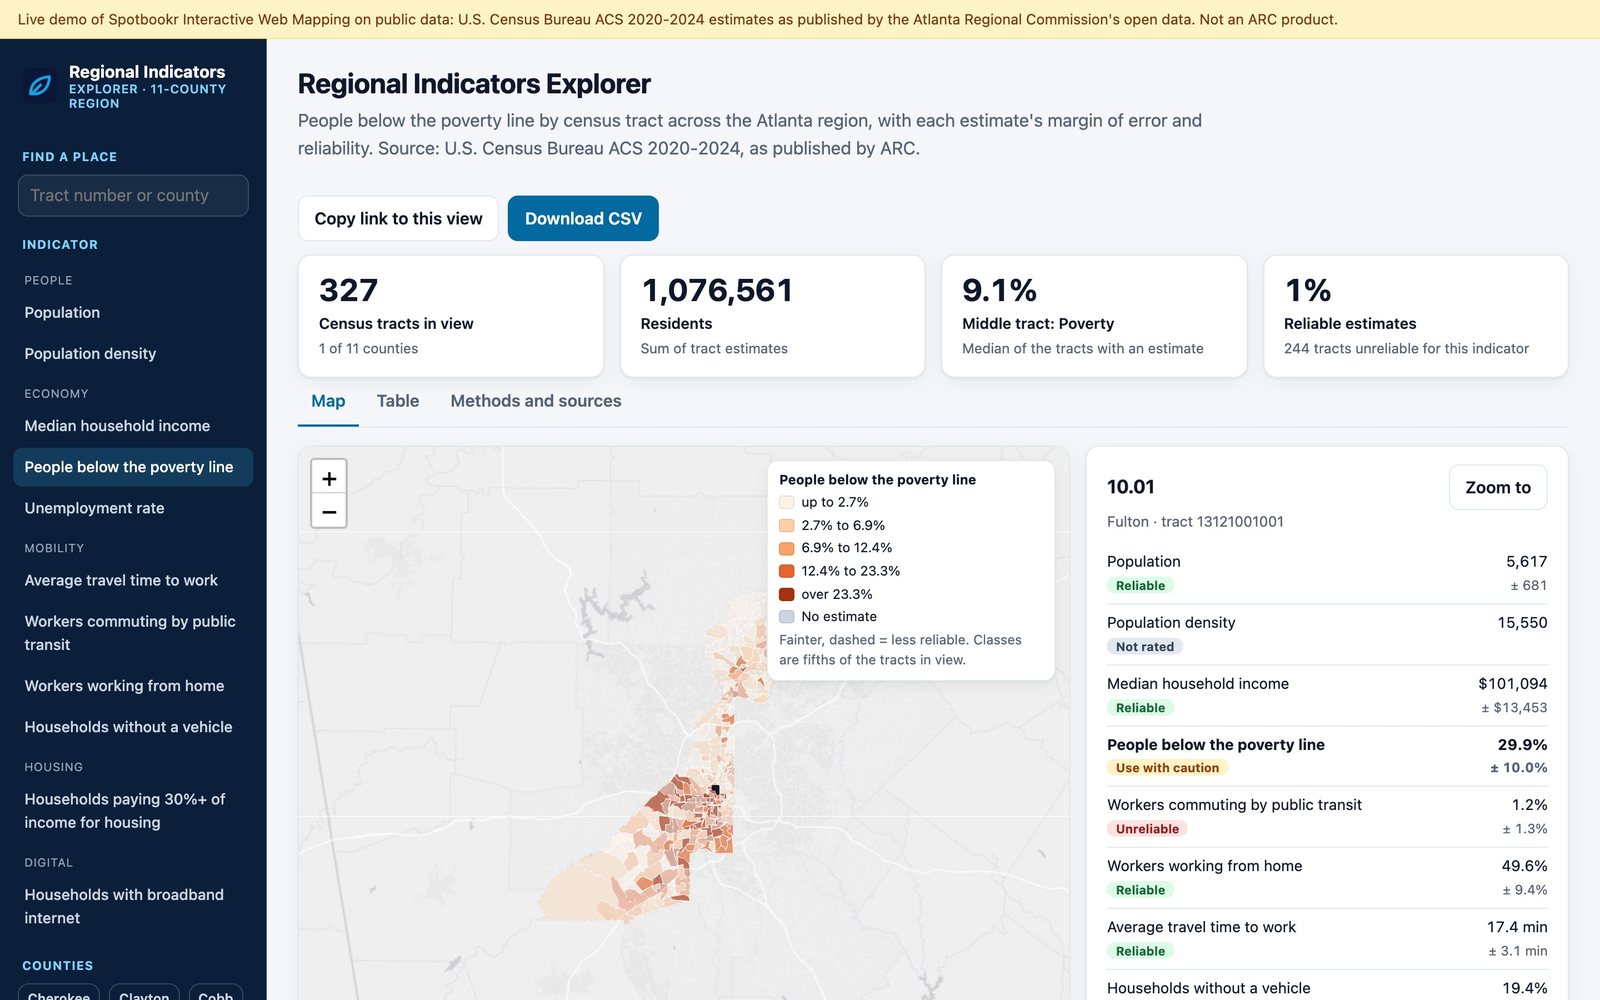
- Choose an indicator. Income, poverty, transit commuting, working from home, travel time to work, households without a car, broadband, housing cost burden, unemployment, population and density.
- Narrow it down. Pick one county or several, and every number on the page follows.
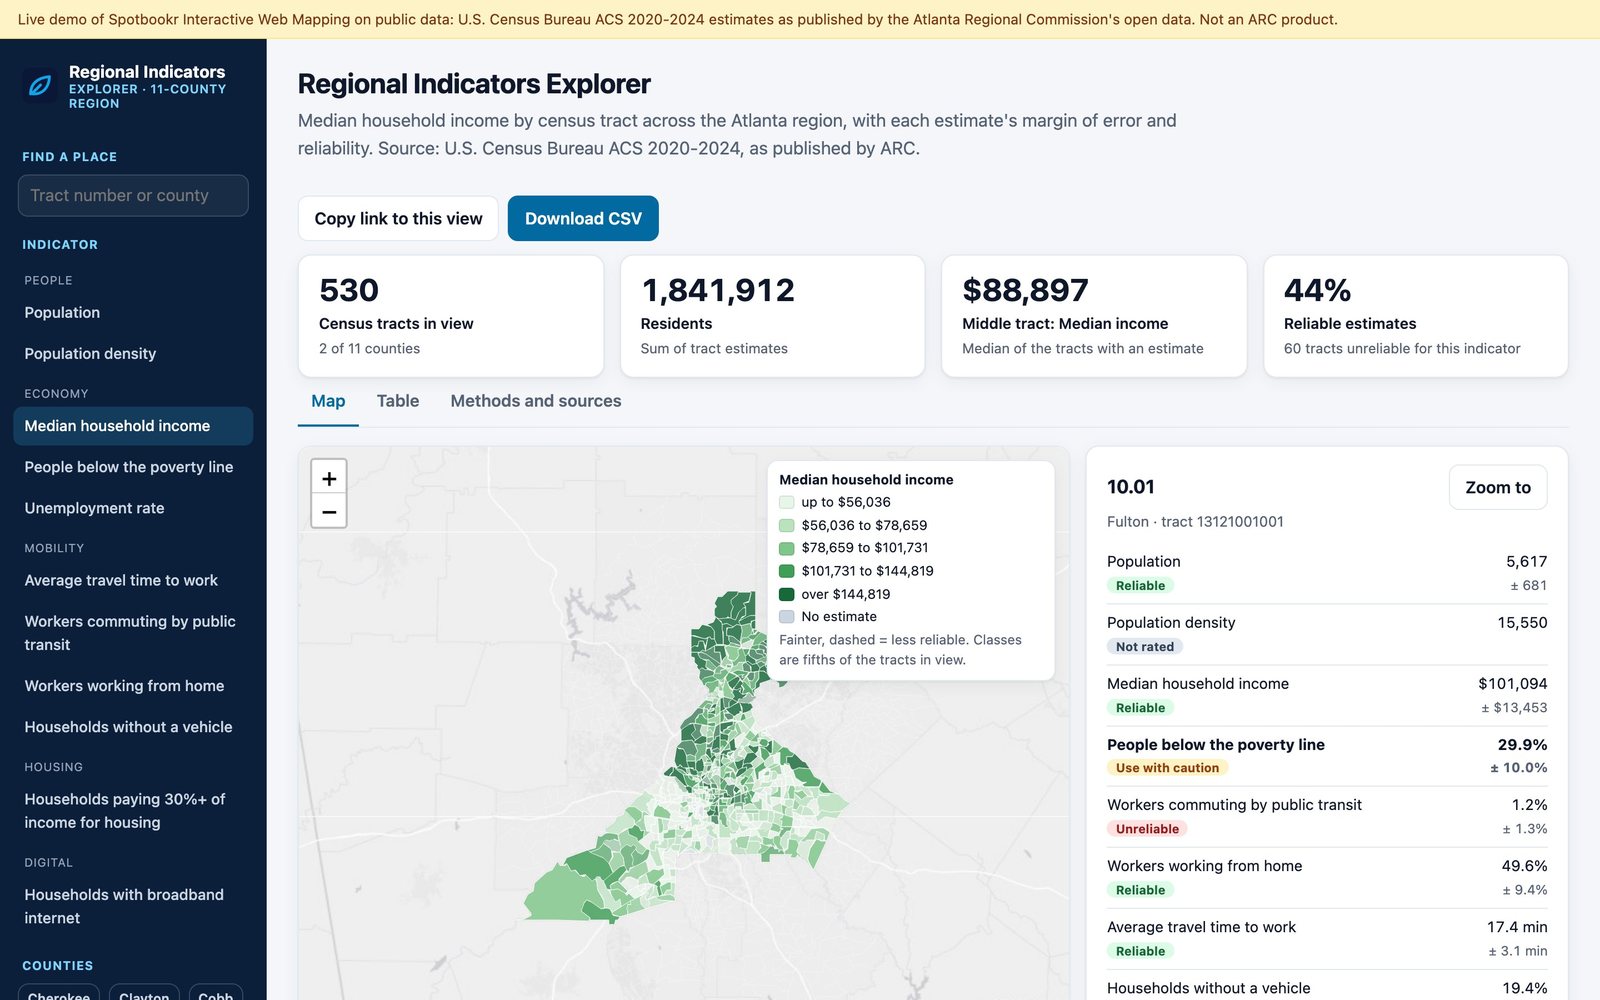
- Open any neighborhood. Click a tract to see all eleven indicators side by side, each with its margin of error.
- Take it with you. Every map is also a sortable table you can download as a spreadsheet, and every view has its own link, so you can send a colleague exactly what you are looking at.
It works on a phone as well as on a computer, in light and dark mode, and it is built to be used with a keyboard and a screen reader.
Every figure shows how much you can trust it
For every estimate, the demo calculates how large its margin of error is compared with the estimate itself, and sorts it into one of three groups: reliable, use with caution, or unreliable. Unreliable estimates are drawn fainter on the map with a dashed outline, a single switch hides them altogether, and every neighborhood profile shows the margin beside the figure.
This is the part of public data work we care most about. A good map should make the solid findings easy to see, and make it hard to mistake a guess for a fact.
What we build for agencies
The demo shows the approach. For an agency, we build the maps and dashboards its own work calls for, on its own data:
- Connected to the source. Applications read from the agency's published data services, so when the agency updates its data, the maps update with it.
- Honest about uncertainty. Margins of error and data-quality notes are part of the design, not a footnote.
- Accessible. Keyboard operation, screen-reader labels, a table behind every map, and colors that do not rely on color alone, tested automatically on every release.
- Owned by the agency. The code, data pipelines and documentation belong to the agency, in open formats, so it is never locked in.
We host the applications, keep them up to date and support the people who use them.
Related questions
What is an interactive web map?
An interactive web map is a map on a web page that people can explore rather than just look at: choosing what to show, zooming to an area, clicking a place for its details and comparing areas. Linked charts and tables update as the map changes.
Where does the demo's data come from?
From the U.S. Census Bureau's American Community Survey 2020-2024 five-year estimates, as published by the region's public open data service. The demo's methods page lists every source and how each figure was prepared.
What is a margin of error, and why does it matter?
Survey figures are estimates, and the margin of error says how far the true value could be from the estimate. For small areas, such as a single census tract, the margin can be large. Showing it stops readers from treating an uncertain figure as a firm one.
Who is Interactive Web Mapping for?
Regional commissions, cities, counties, state agencies and other public bodies that publish data and want residents, partners and their own staff to be able to use it.
Interactive Web Mapping is available now. Try the live demo at iwm-demo.spotbookr.com, or read more on our Government Solutions page.