01 / 08 · Map
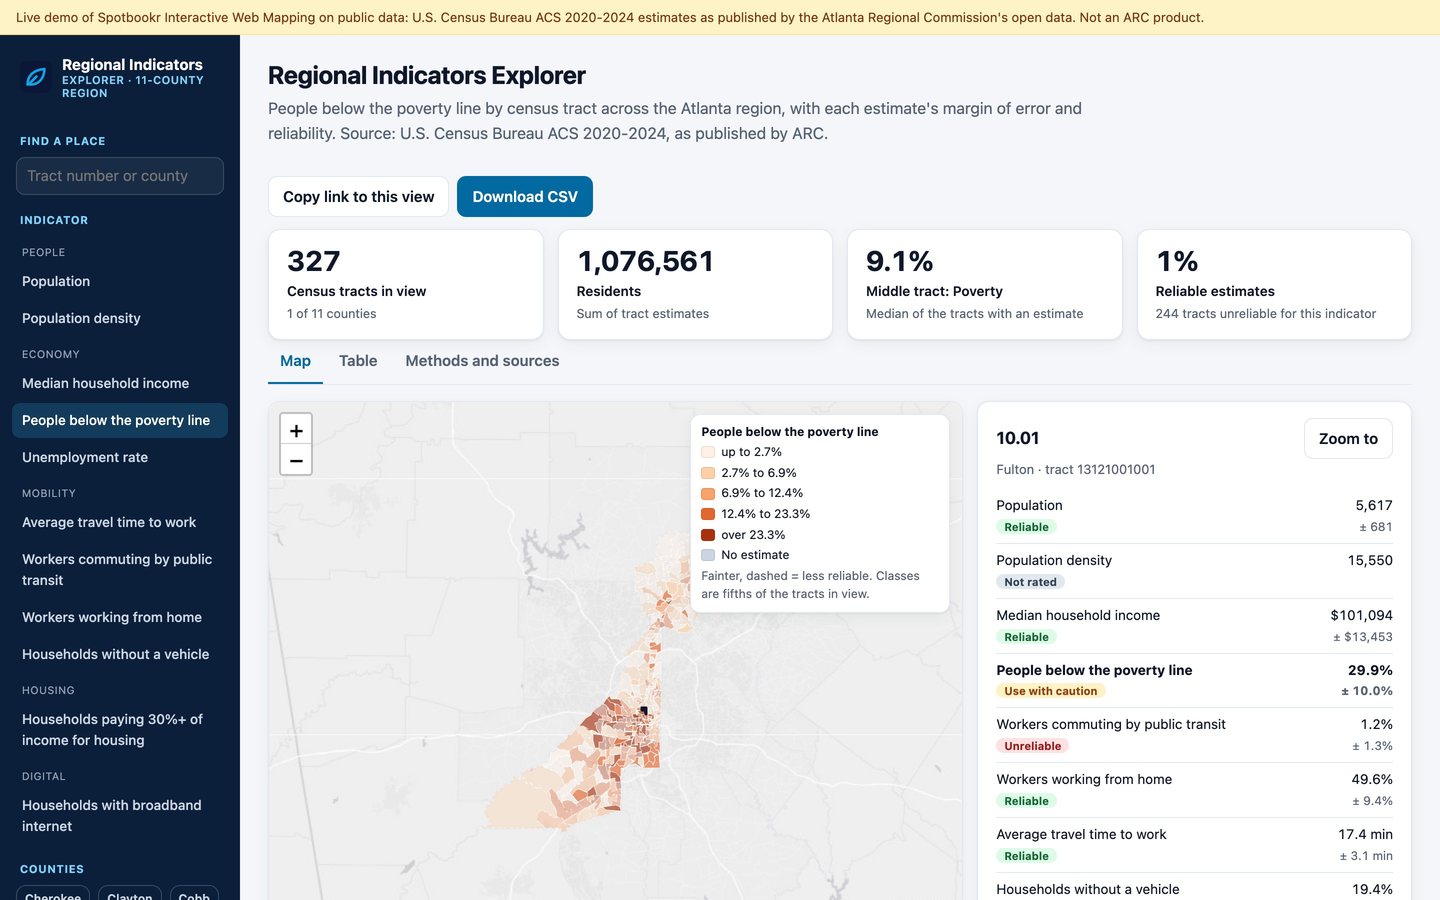
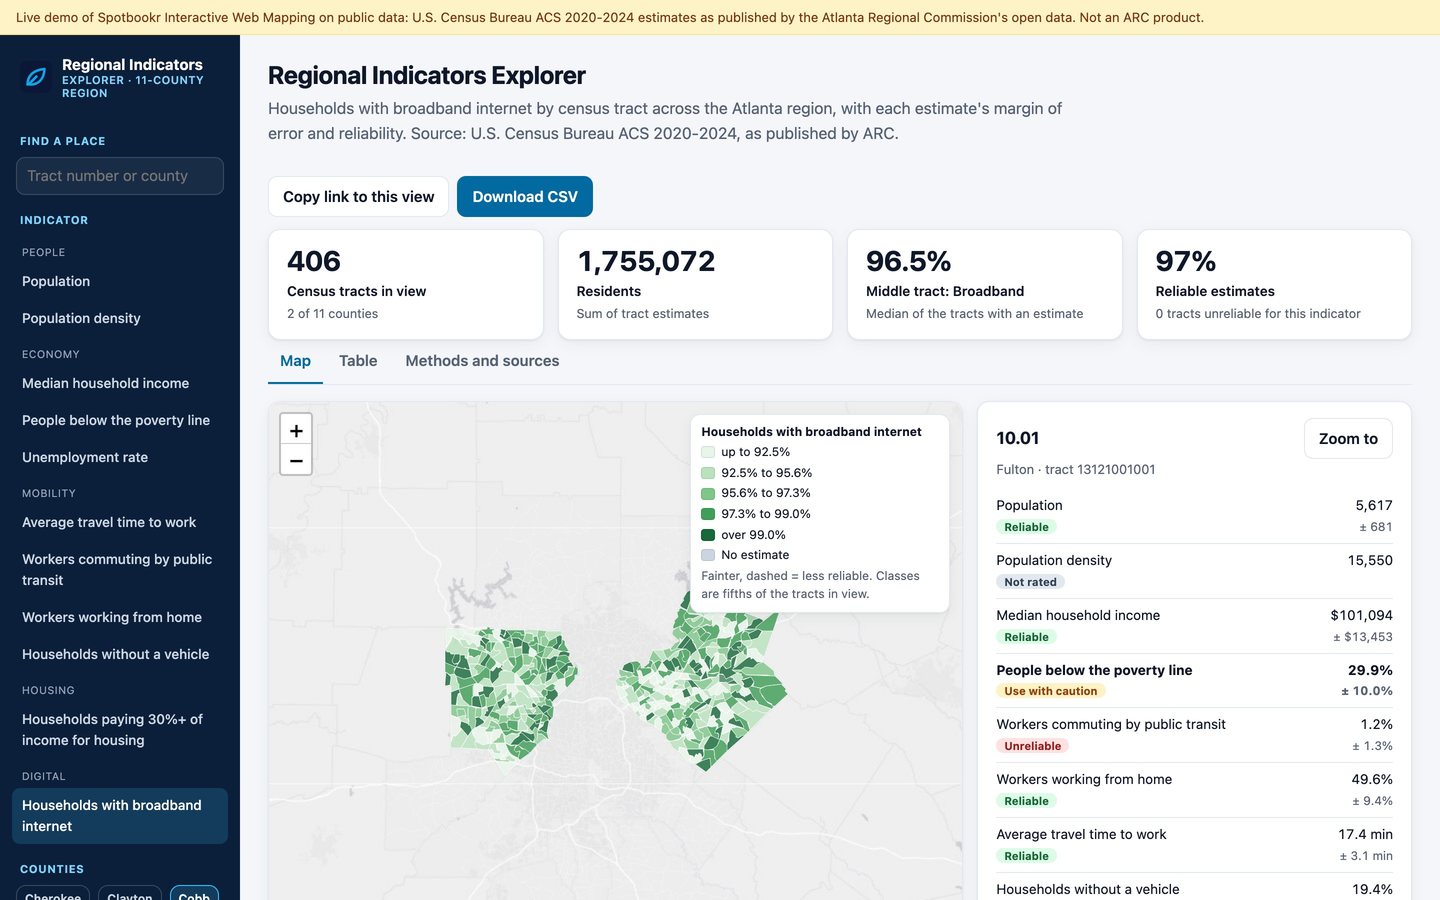
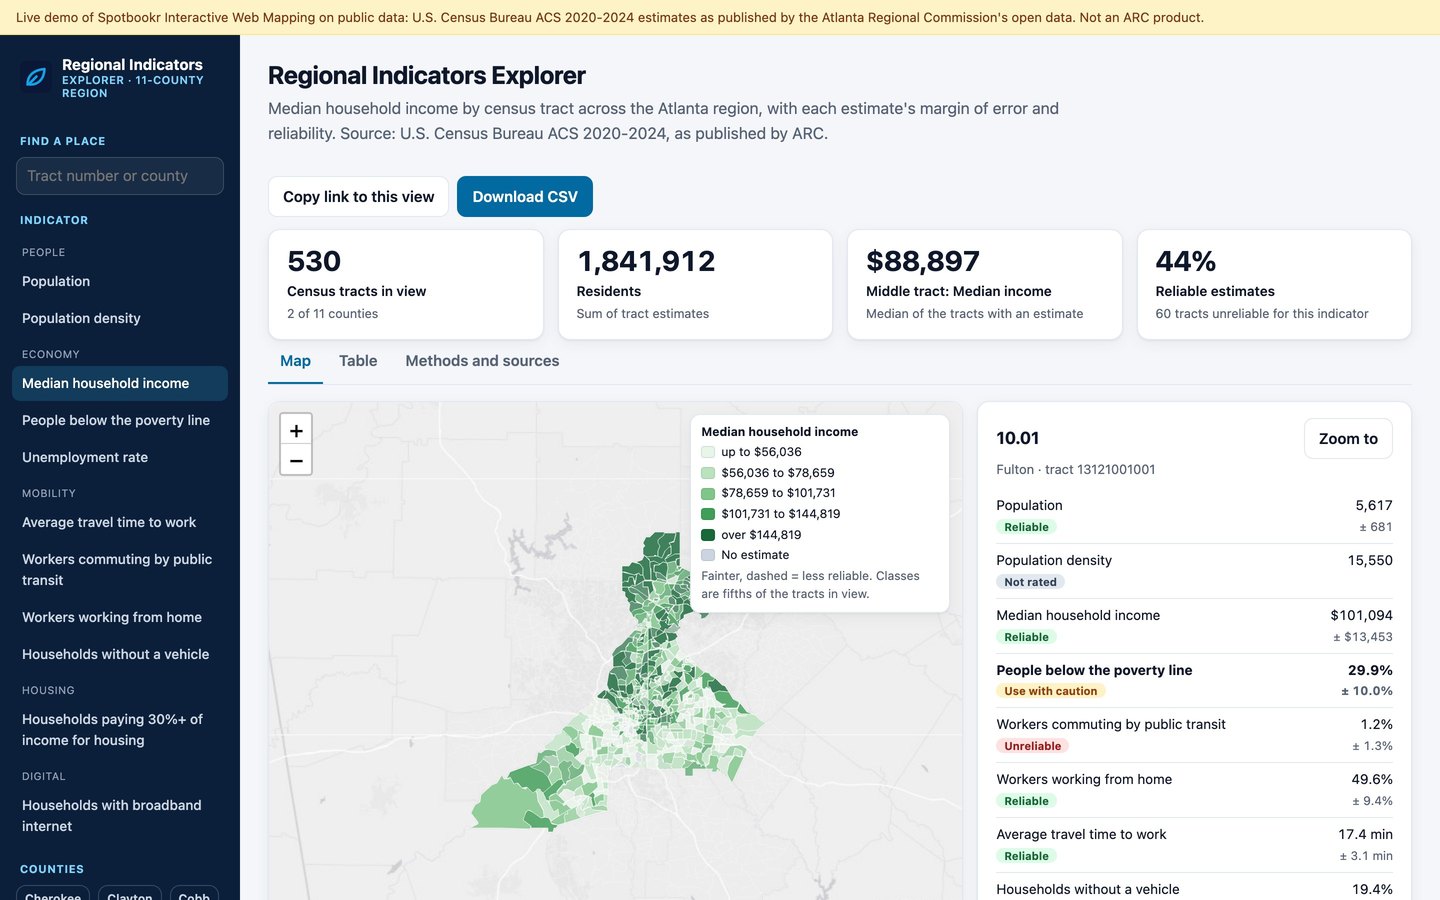
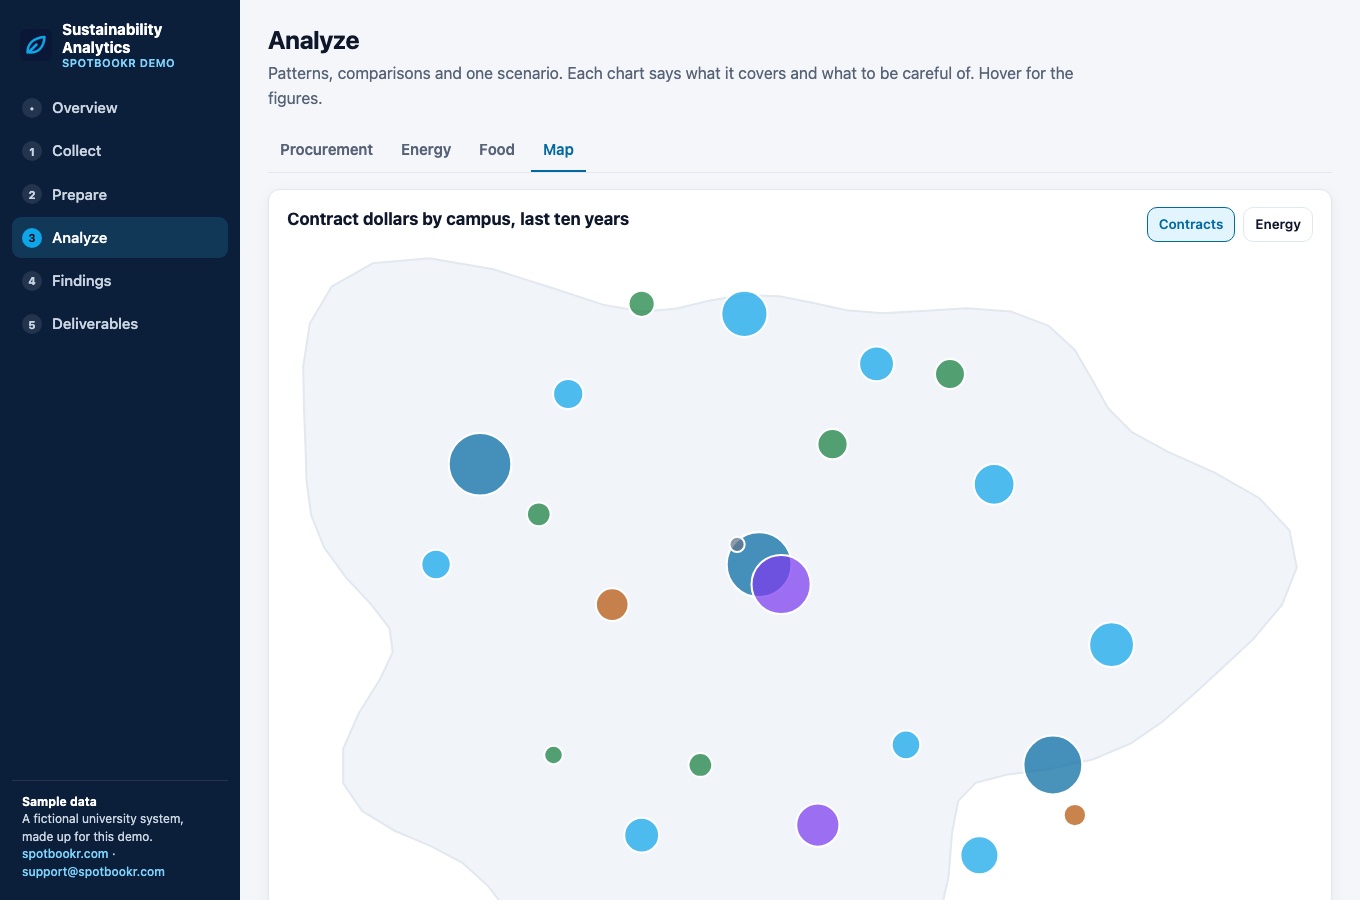
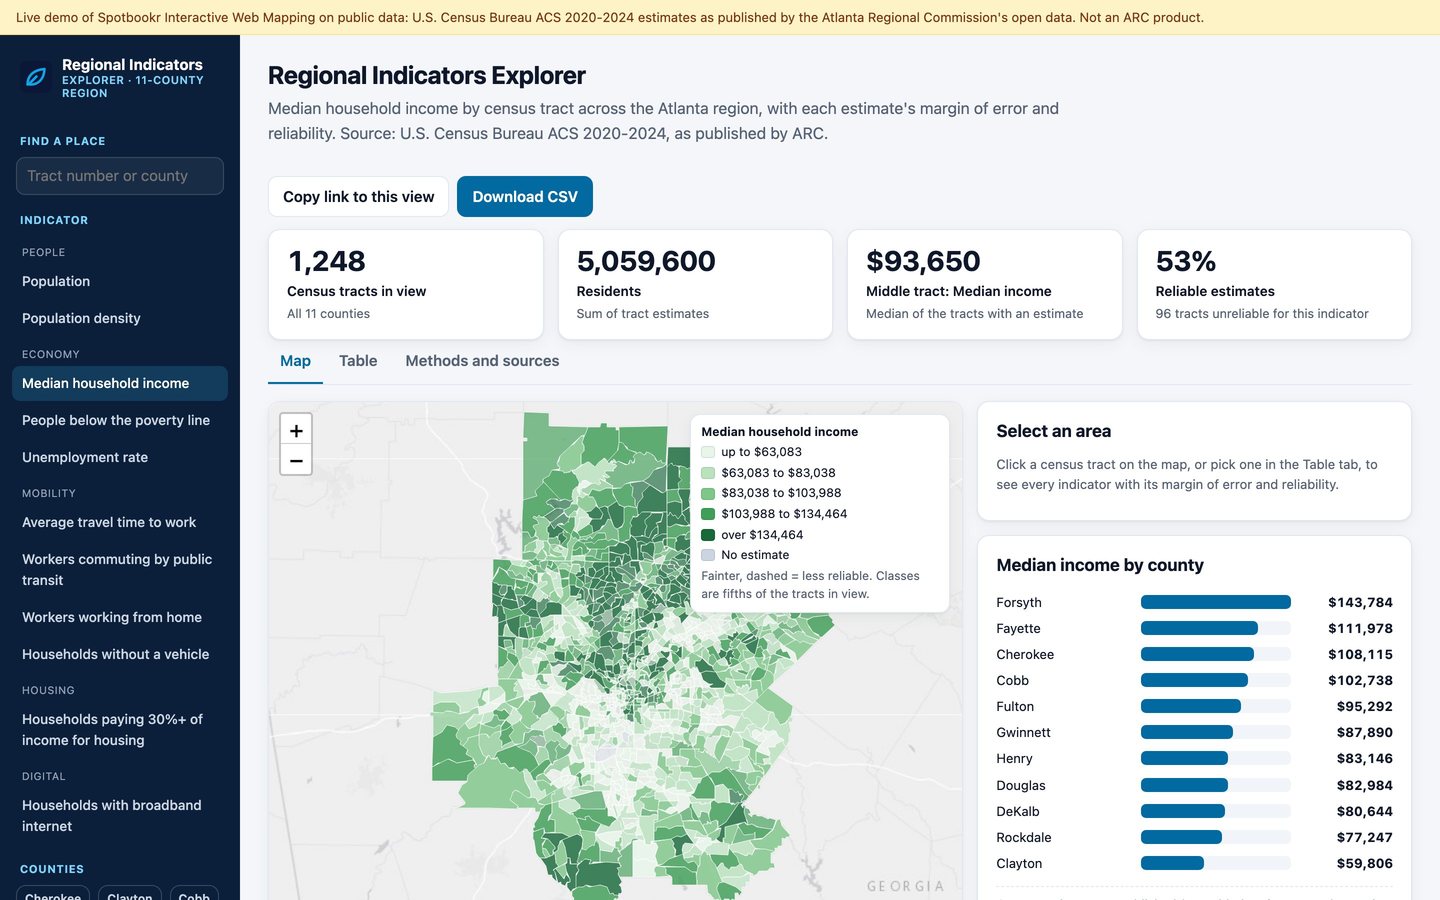
The whole region on one map
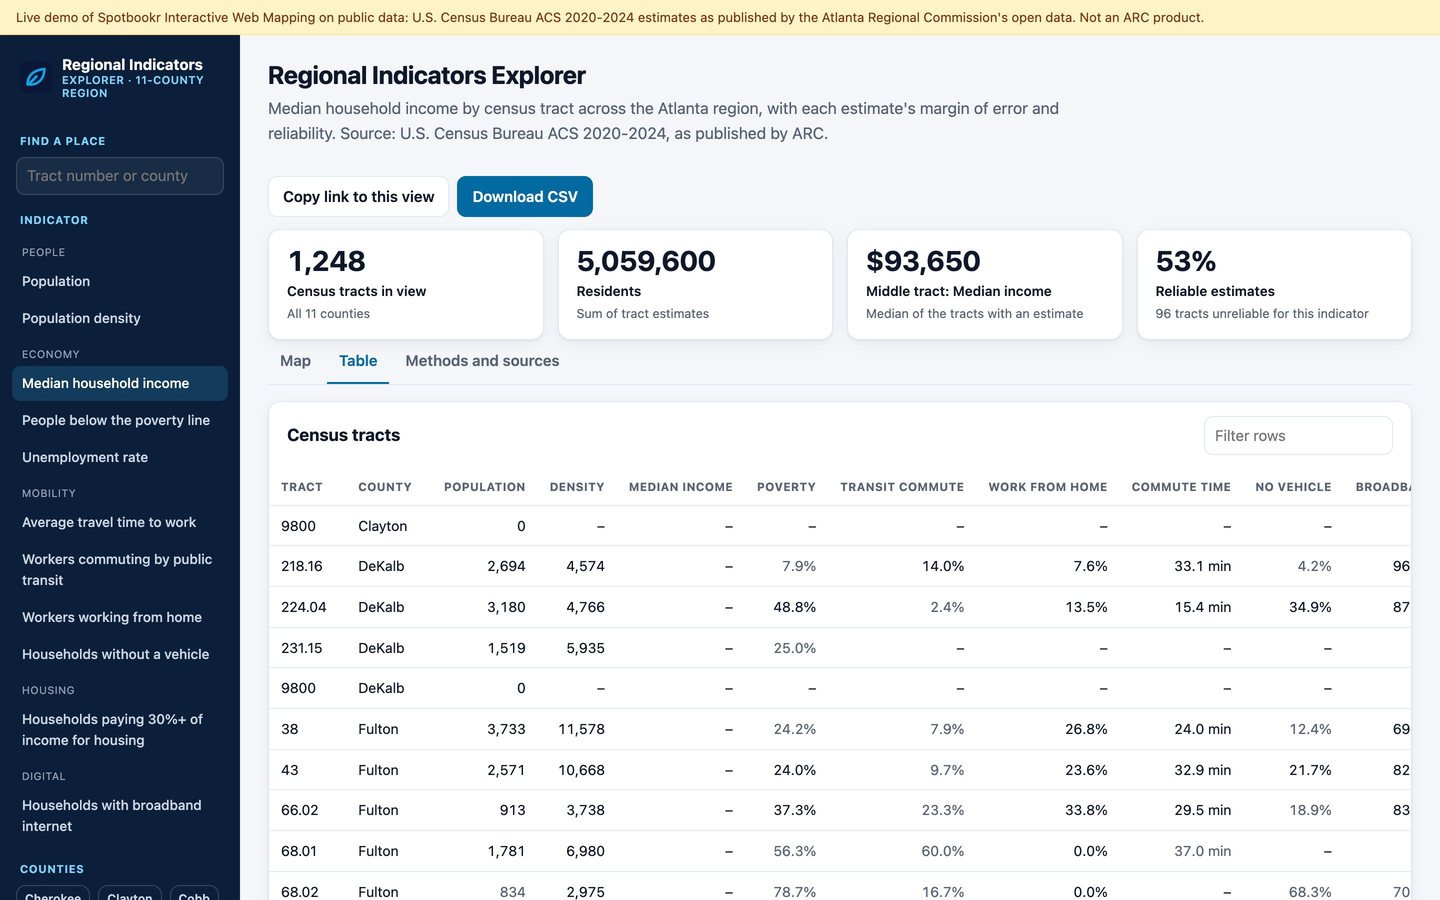
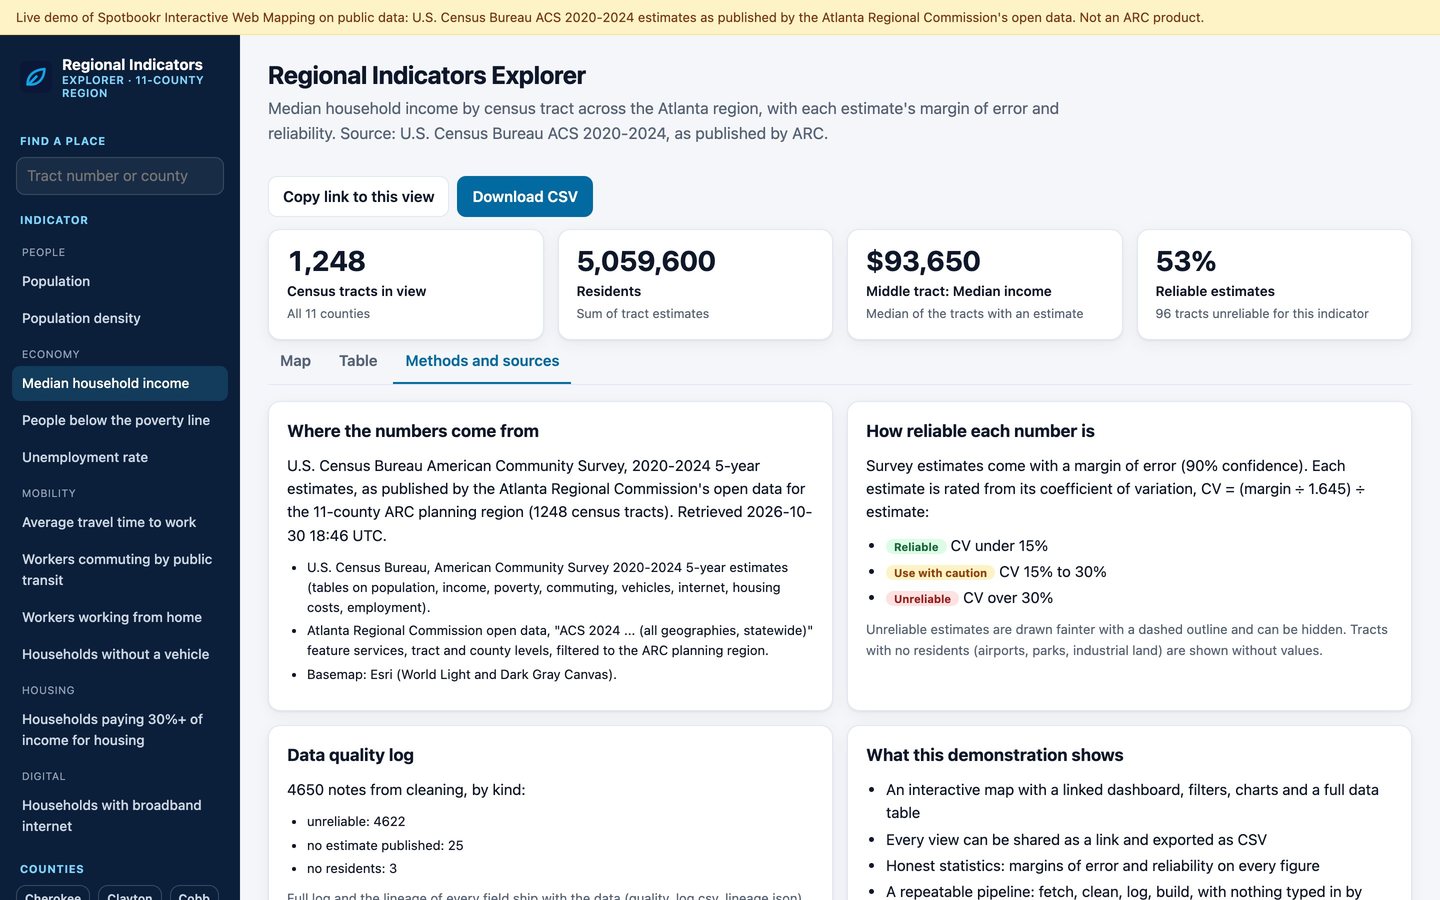
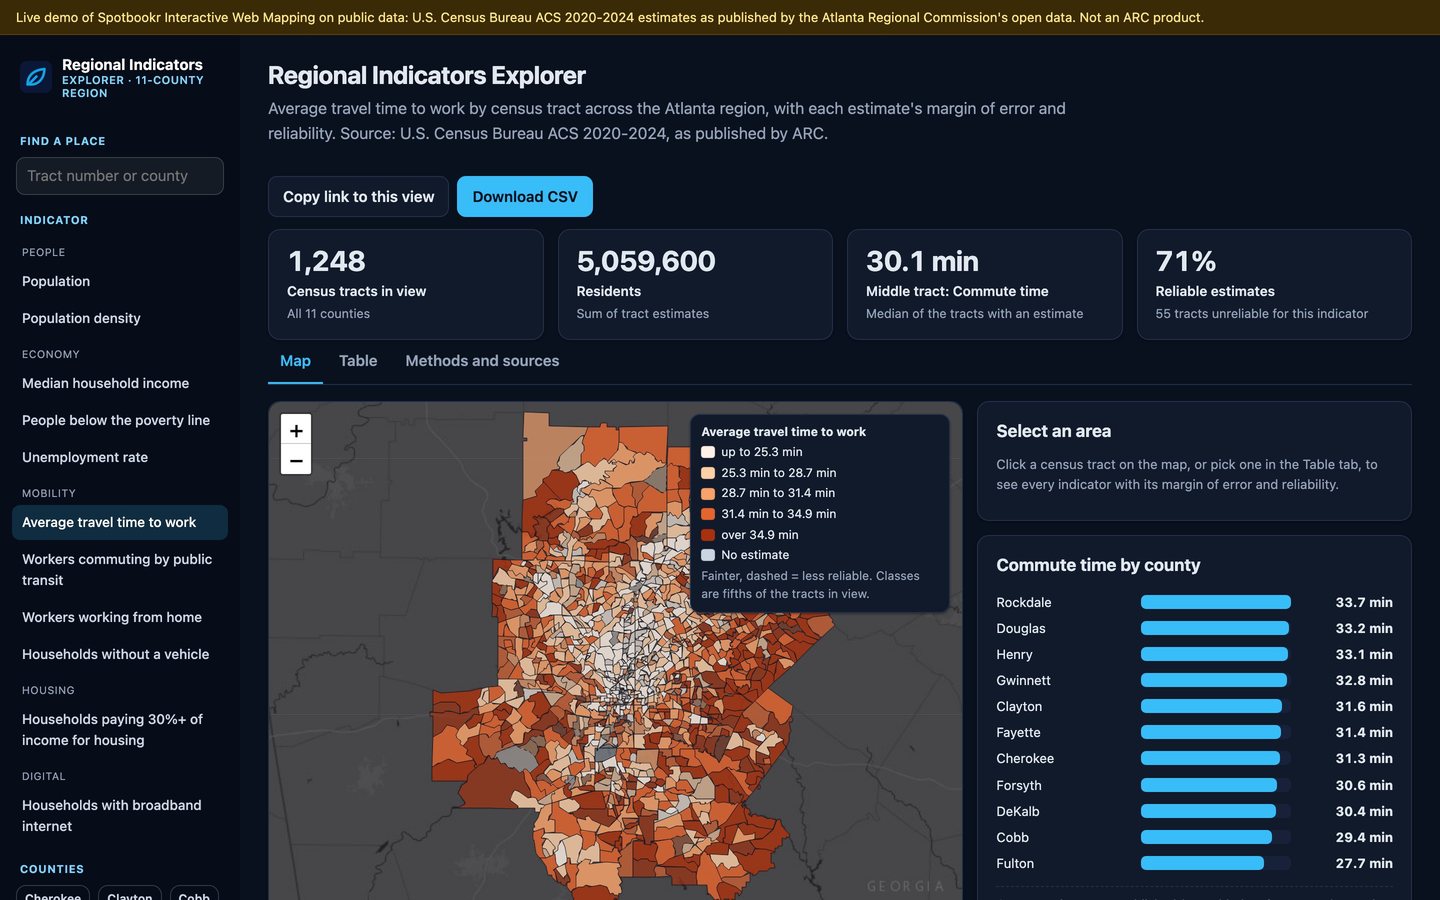
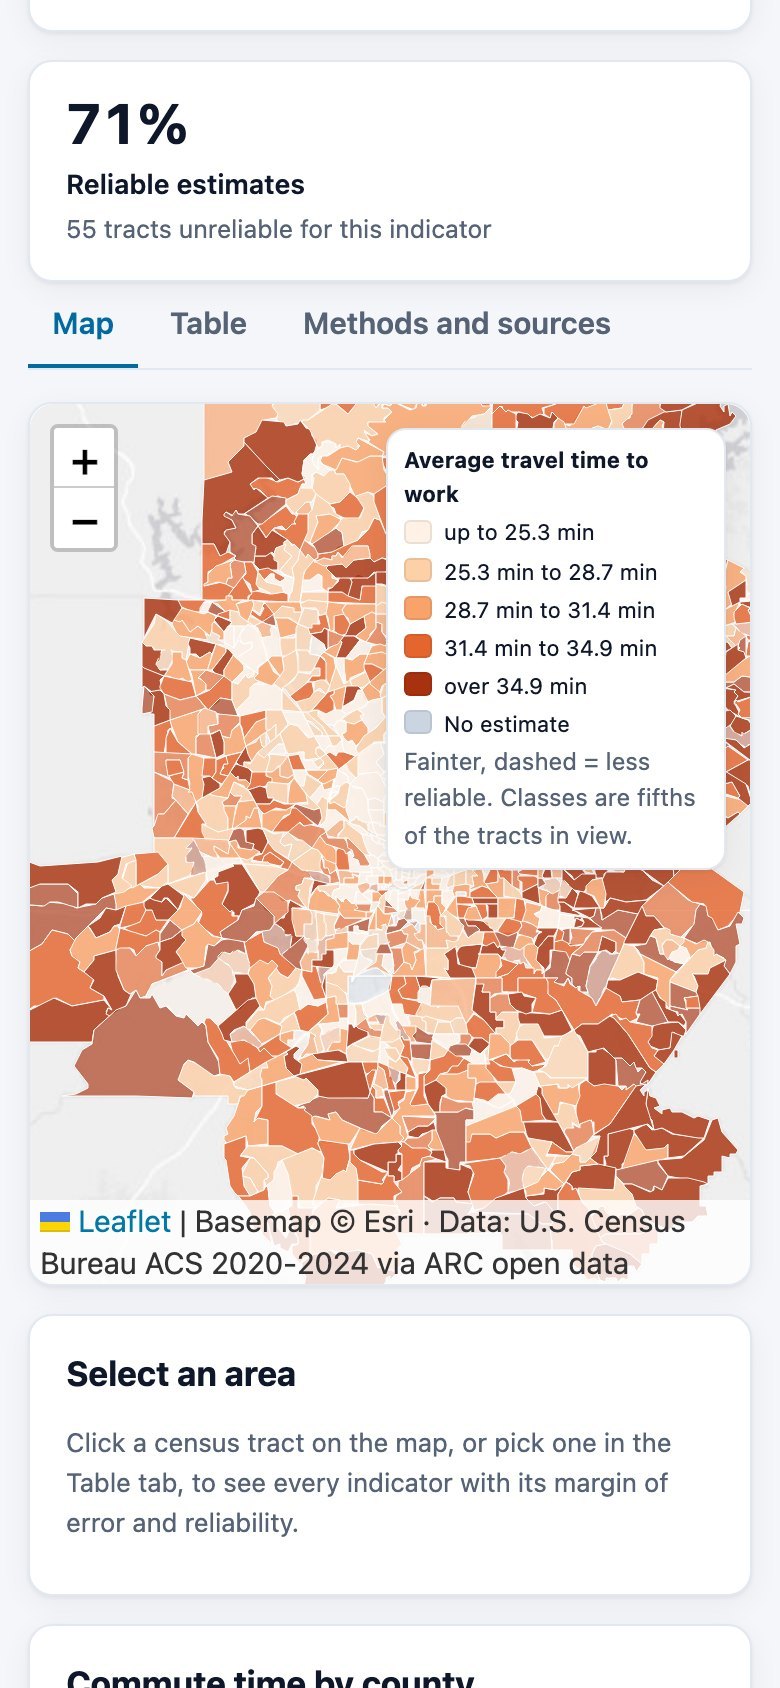
Every census tract coloured by the figure you choose, from income to commute times, with a legend that tells you exactly where each colour starts and ends.
- Eleven indicators, one click each
- Classes drawn from the tracts in view
- Light and dark basemaps